Graph Analysis of the Ethereum Blockchain Data: A Survey of Datasets, Methods, and Future Work
A summary of the IEEE Blockchain 2022 research paper by Arijit Khan.
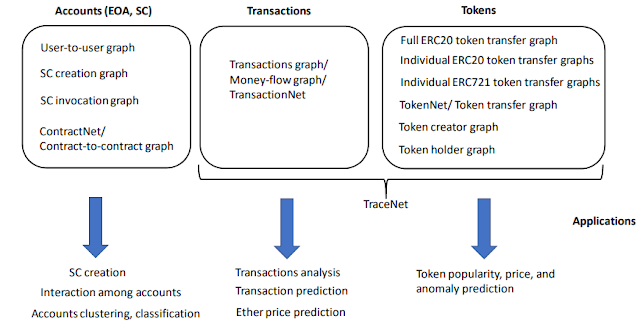
Objective: Ethereum [1], currently the most actively-used and the second-largest blockchain platform [2], consists of a heterogeneous ecosystem, cohabited by human users, smart contracts (autonomous agents), ether (native cryptocurrency), tokens (digital assets), dApps (decentralized applications), and DeFi (decentralized finance). These key actors in the Ethereum interact with each other via transactions and contract calls. Given the highly connected structure, graph-based modeling is an optimal tool to analyze the data stored in Ethereum blockchain. Data stored in a public blockchain such as in Ethereum can be considered as big data -- Ethereum archive nodes that store a complete snapshot of the Ethereum blockchain, including all the transaction records, take up to 4TB of space [3], thus data analytic methods can be applied to extract knowledge hidden in the blockchain. Ethereum blockchain has processed more than 1.1 million transactions per day in July 2021 [4] and contains a vast amount of heterogeneous interactions, e.g., user-to-user, user-to-contract, contract-to-user, and contract-to-contract across multiple layers via external and internal transactions, ether, tokens, dAapps, etc. that can be modeled as complex, dynamic, multi-layer networks [5, 6, 7]. Recently, several research works performed graph analysis on the publicly available Ethereum blockchain data to reveal insights into its transactions and for important downstream tasks, e.g., cryptocurrency price prediction, address clustering, phishing scams and counterfeit tokens detection. We present in Figure 1 a summary diagram of several graphs that can be constructed based on interactions between accounts, transactions, and token transfers; together with their applications.
Figure 1: Various graphs created from interactions between accounts, transactions, token transfers; as well as their common applications.
In this work, we conducted an in-depth survey of the existing literature -- we categorized them based on publication years, venues, core ranking, and authors’ affiliations, data usage and graphs construction, graph mining and machine learning techniques employed, and the new insights derived by them.
A. Publication Venues and Affiliations: Figure 2 presents distributions of papers and co-authors based on publication venues, years, categories, publishers, and authors’ affiliations. Among 25 papers surveyed, 11 were published in 2020, which is currently the maximum in a year (Figure 2(a)). More papers were published at conferences and workshops, than in journals. Eight papers were published at core A∗ and A venues (Figure 2(b)). IEEE, ACM, and Springer published majority of these papers (Figure 2(c)). Based on authors’ affiliations, more papers and co-authors are from China and USA (Figure 2(d)). Prominent research groups working in this domain are from Sun Yat-sen University or SYSU (China), MIT Media Lab (USA), Tel Aviv University (Israel), Endor Ltd. (Israel), Nanyang Technological University or NTU (Singapore), the Hong Kong Polytechnic University (China), and the University of Manitoba (Canada). The SYSU group also open-sourced several well-curated Ethereum blockchain datasets [8].
B. Datasets and Graphs: Our surveyed papers vary based on data extraction methods, dataset durations, and the graphs constructed (Table I). The wide spectrum of graphs constructed by our 25 surveyed papers is a testimony to the rich and diverse ecosystem of Ethereum blockchain. For instance, external transactions and token-based graphs can be further classified into multiple sub-categories, e.g., user-to-user, contract-to-contract, contract creation and invocation graphs, full token network, individual token networks, ERC20 token graphs, ERC721 token graphs, etc. (Figure 1). Moreover, one can obtain datasets for different kinds of graphs related research, including static graphs, dynamic graphs, temporal snapshot graphs, directed graphs, weighted graphs, simple and multi-graphs, attributed graphs, multi-layer networks, and even datasets for machine learning and topological data analysis. This demonstrates the research value of the data stored on Ethereum blockchain.
For more information, click here for our paper.
References:
[1]https://ethereum.org/en/whitepaper/
[2]https://www.statista.com/statistics/807195/ethereum-market-capitalization-quarterly/
[3]https://decrypt.co/24779/ethereum-archive-nodes-now-take-up-4-terabytes-of-space
[4]https://www.statista.com/statistics/730838/number-of-daily-cryptocurrency-transactions-by-type/
[5]L. Zhao, S. S. Gupta, A. Khan, and R. Luo, “Temporal Analysis of the Entire Ethereum Blockchain Network,” in WWW, 2021.
[6]Q. Bai, C. Zhang, Y. Xu, X. Chen, and X. Wang, “Evolution of Ethereum: A Temporal Graph Perspective,” in IFIP Net. Conf., 2020.
[7]D. Ofori-Boateng, I. Segovia-Dominguez, C. G. Akcora, M. Kantarcioglu, and Y. R. Gel, “Topological Anomaly Detection in Dynamic Multilayer Blockchain Networks,” in ECML PKDD, 2021.
[8]P. Zheng, Z. Zheng, J. Wu, and H. Dai, “Xblock-eth: Extracting and exploring blockchain data from ethereum,” IEEE Open J. Comput. Soc., vol. 1, pp. 95–106, 2020.
[9]A.-D. Vo, Q.-P. Nguyen, and C.-Y. Ock, “Sentiment Analysis of News for Effective Cryptocurrency Price Prediction,” International Journal of Knowledge Engineering, vol. 5, no. 2, pp. 47–52, 2019.


Comments
Post a Comment